Data Table
Photo: net photosynthesis; Cond: stomatal conductance to H2O; Ci: intercellular CO2 concentration;
Trmmol: transpiration rate; Under: Underground biomass; Above: Aboveground biomass
Trmmol: transpiration rate; Under: Underground biomass; Above: Aboveground biomass
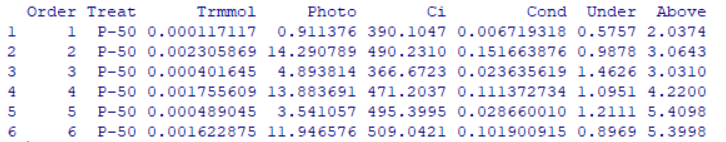
Tab 1. Physiological data from LI-6400 XT portable photosynthesis system, including net photosynthesis, stomatal conductance to H2O, intercellular CO2 concentration, transpiration rate. And underground biomass, aboveground biomass.
Residual Polt
Fig 8 is showing us the residual plot of the original aboveground biomass data of B. napus from six treatments. From this residual plot, we can see that the assumption of normality and homogeneity of data are acceptable. But there are also outliers in this residual plot.
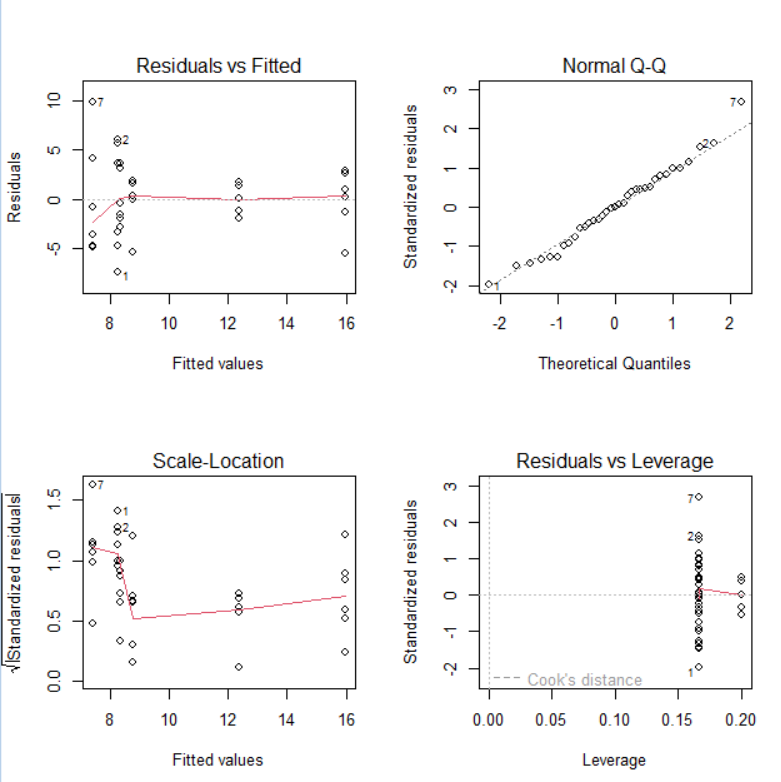
Fig 8. Residual plot of the original aboveground biomass data of B. napus from six treatments
Exploratory Graphics
Fig 9. Stomatal is an important gateway for plants to control carbon and water exchange between leaves and the atmosphere, and stomatal conductance simulation is an indispensable part of accurately simulating the carbon-water cycle in terrestrial ecosystems (Hetherington & Woodward, 2003). Plants balance and optimize the relationship between photosynthesis and transpiration rate by regulating stomatal conductance.
|
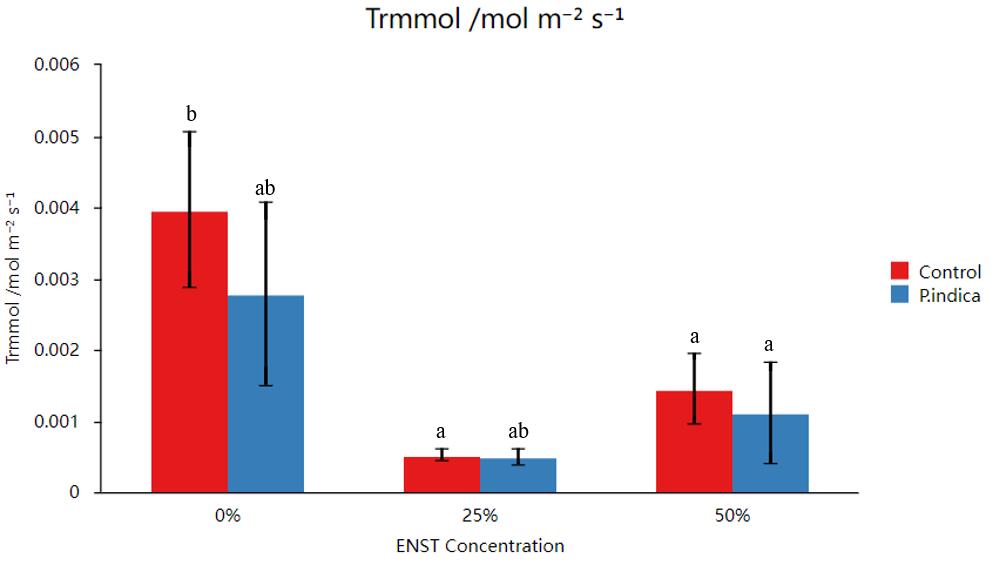
Fig 10. There are two modes of transpiration in leaves: one is the transpiration through the cuticle, which is called cuticular transpiration. The stratum corneum itself is not easy for water to pass through, but it contains pectin with strong water absorption capacity, and there are gaps in the stratum corneum that allow water molecules to pass through. The second is stomatal transpiration. The proportion of these two types of transpiration in leaves is related to the ecological conditions of the plant and the age of the leaves, and is essentially related to the thickness of the cuticle.
|
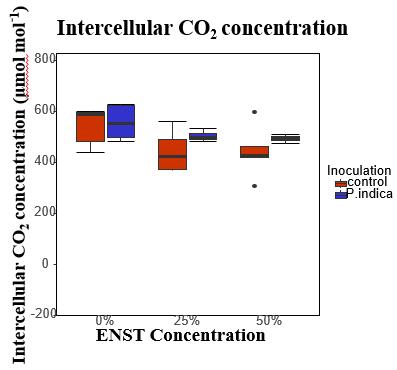
Fig 11. As the stomatal conductance decreases, the intercellular carbon dioxide concentration also decreases, but due to multiple effects such as photosynthesis and respiration, the intercellular carbon dioxide concentration has different trends.
|
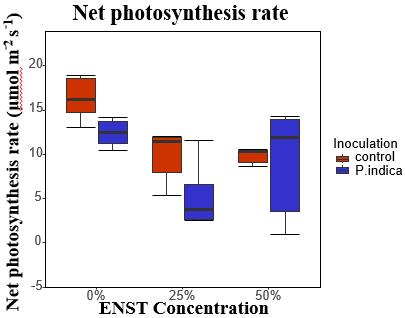
Fig 12. Net photosynthesis, also known as apparent photosynthesis, refers to the total amount of photosynthesis in plants minus the amount of respiration within a period of time. Net photosynthesis is the increase (or decrease) of the dry matter of plants that results from the difference between gross photosynthesis and losses due to the respiration and the death of the plant part.
|
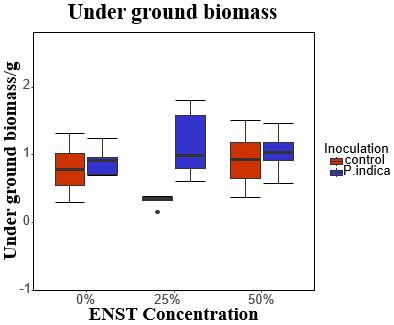
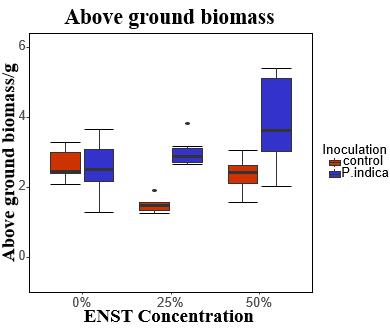
Fig 13,14. Aboveground biomass and belowground biomass are directly dried and weighed. These two physiological parameter can intuitively show the growth condition of plants and help us compare the effects of different treatment groups.
